AI Insight
A 20-year satellite study of tidal wetlands across the contiguous United States found that gross primary production increased by 6% between 2001 and 2020, with the strongest gains in the Gulf and southern Atlantic regions. The increase was primarily driven by rising temperatures and increased sunlight rather than changes in vegetation greenness. Temperature emerged as the strongest factor influencing year-to-year variability in tidal wetland productivity, followed by solar radiation and vegetation indices.
Why it matters
These findings are important for carbon sequestration strategies and climate mitigation planning, demonstrating that climate factors rather than vegetation changes are the primary drivers of increased carbon capture in tidal wetlands. This information should inform wetland management practices and improve the accuracy of carbon cycle models used for climate projections.
Understand the Science
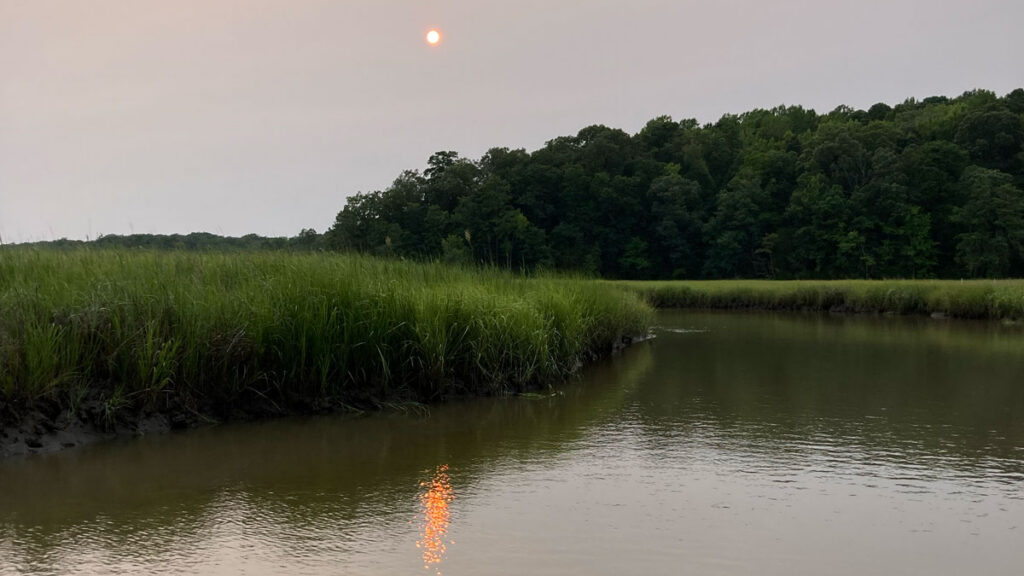
Source: Global Biogeochemical Cycles
Carbon sequestration, climate regulation, biodiversity support, and shoreline protection: These are all benefits provided by tidal wetlands. As the climate changes, the amount of carbon captured by these vital ecosystems may be changing as well.
Gross primary production (GPP) describes how much carbon is fixed by vegetation via photosynthesis. It’s an important metric for understanding potential carbon sequestration, especially as it relates to larger climate mitigation strategies and metrics. Previous studies of tidal wetland carbon dynamics have generally focused on individual locations rather than large-scale trends.
Using a satellite dataset spanning 2001 to 2020, Herrmann et al. examined how tidal wetland GPP changed across the contiguous United States over the past 2 decades. The team analyzed regional differences in tidal wetland productivity and examined how climate and vegetation influenced how much carbon was produced over the course of 20 years.
The dataset used in the study is derived from satellite observations, and it groups wetlands into woody and herbaceous, two types defined by the National Wetlands Inventory. Using a 250-meter resolution and 16-day time stamps of vegetation conditions, combined with information about air temperature and shortwave radiation, researchers modeled the evolution of GPP across seven coastal regions and a countrywide total. In their modeling, the researchers kept the wetland extent fixed at its year 2000 distribution.
Overall, GPP increased by 6% over the study period, with the strongest increases occurring in the Gulf and southern Atlantic regions. The increases are driven by climate changes, namely, warming trends and increased sunlight. In contrast, changes in the enhanced vegetation index (EVI), used to quantify greenness, contributed to a slight decrease in overall GPP.
Across all tidal wetland areas, the variation in GPP year to year is relatively modest, though the most variation occurs in the western Gulf of Mexico, likely thanks to the influence of hurricanes, tropical storms, flooding, and drought. Temperature is the strongest driver of variability in tidal wetland productivity, followed by shortwave radiation and then EVI.
Overall, these findings suggest that shifts in temperature and sunlight—rather than changes in vegetation—are responsible for increases in tidal wetland productivity and that this information should be considered when managing tidal wetlands or creating carbon cycle models. (Global Biogeochemical Cycles, https://doi.org/10.1029/2026GB009093, 2026)
—Rebecca Owen (@beccapox.bsky.social), Science Writer